Network inspection
Inspect all network activity from your CI job, like DevTools for your pipeline
Shipfox can captures all network requests made during the lifetime of a job. This makes it easy to debug API calls, external service failures, and connectivity issues, just like you would with your browser's developer tools.
This is a beta feature which is currently opt-in only. If you are interested in trying it, get in touch with us.
How it works
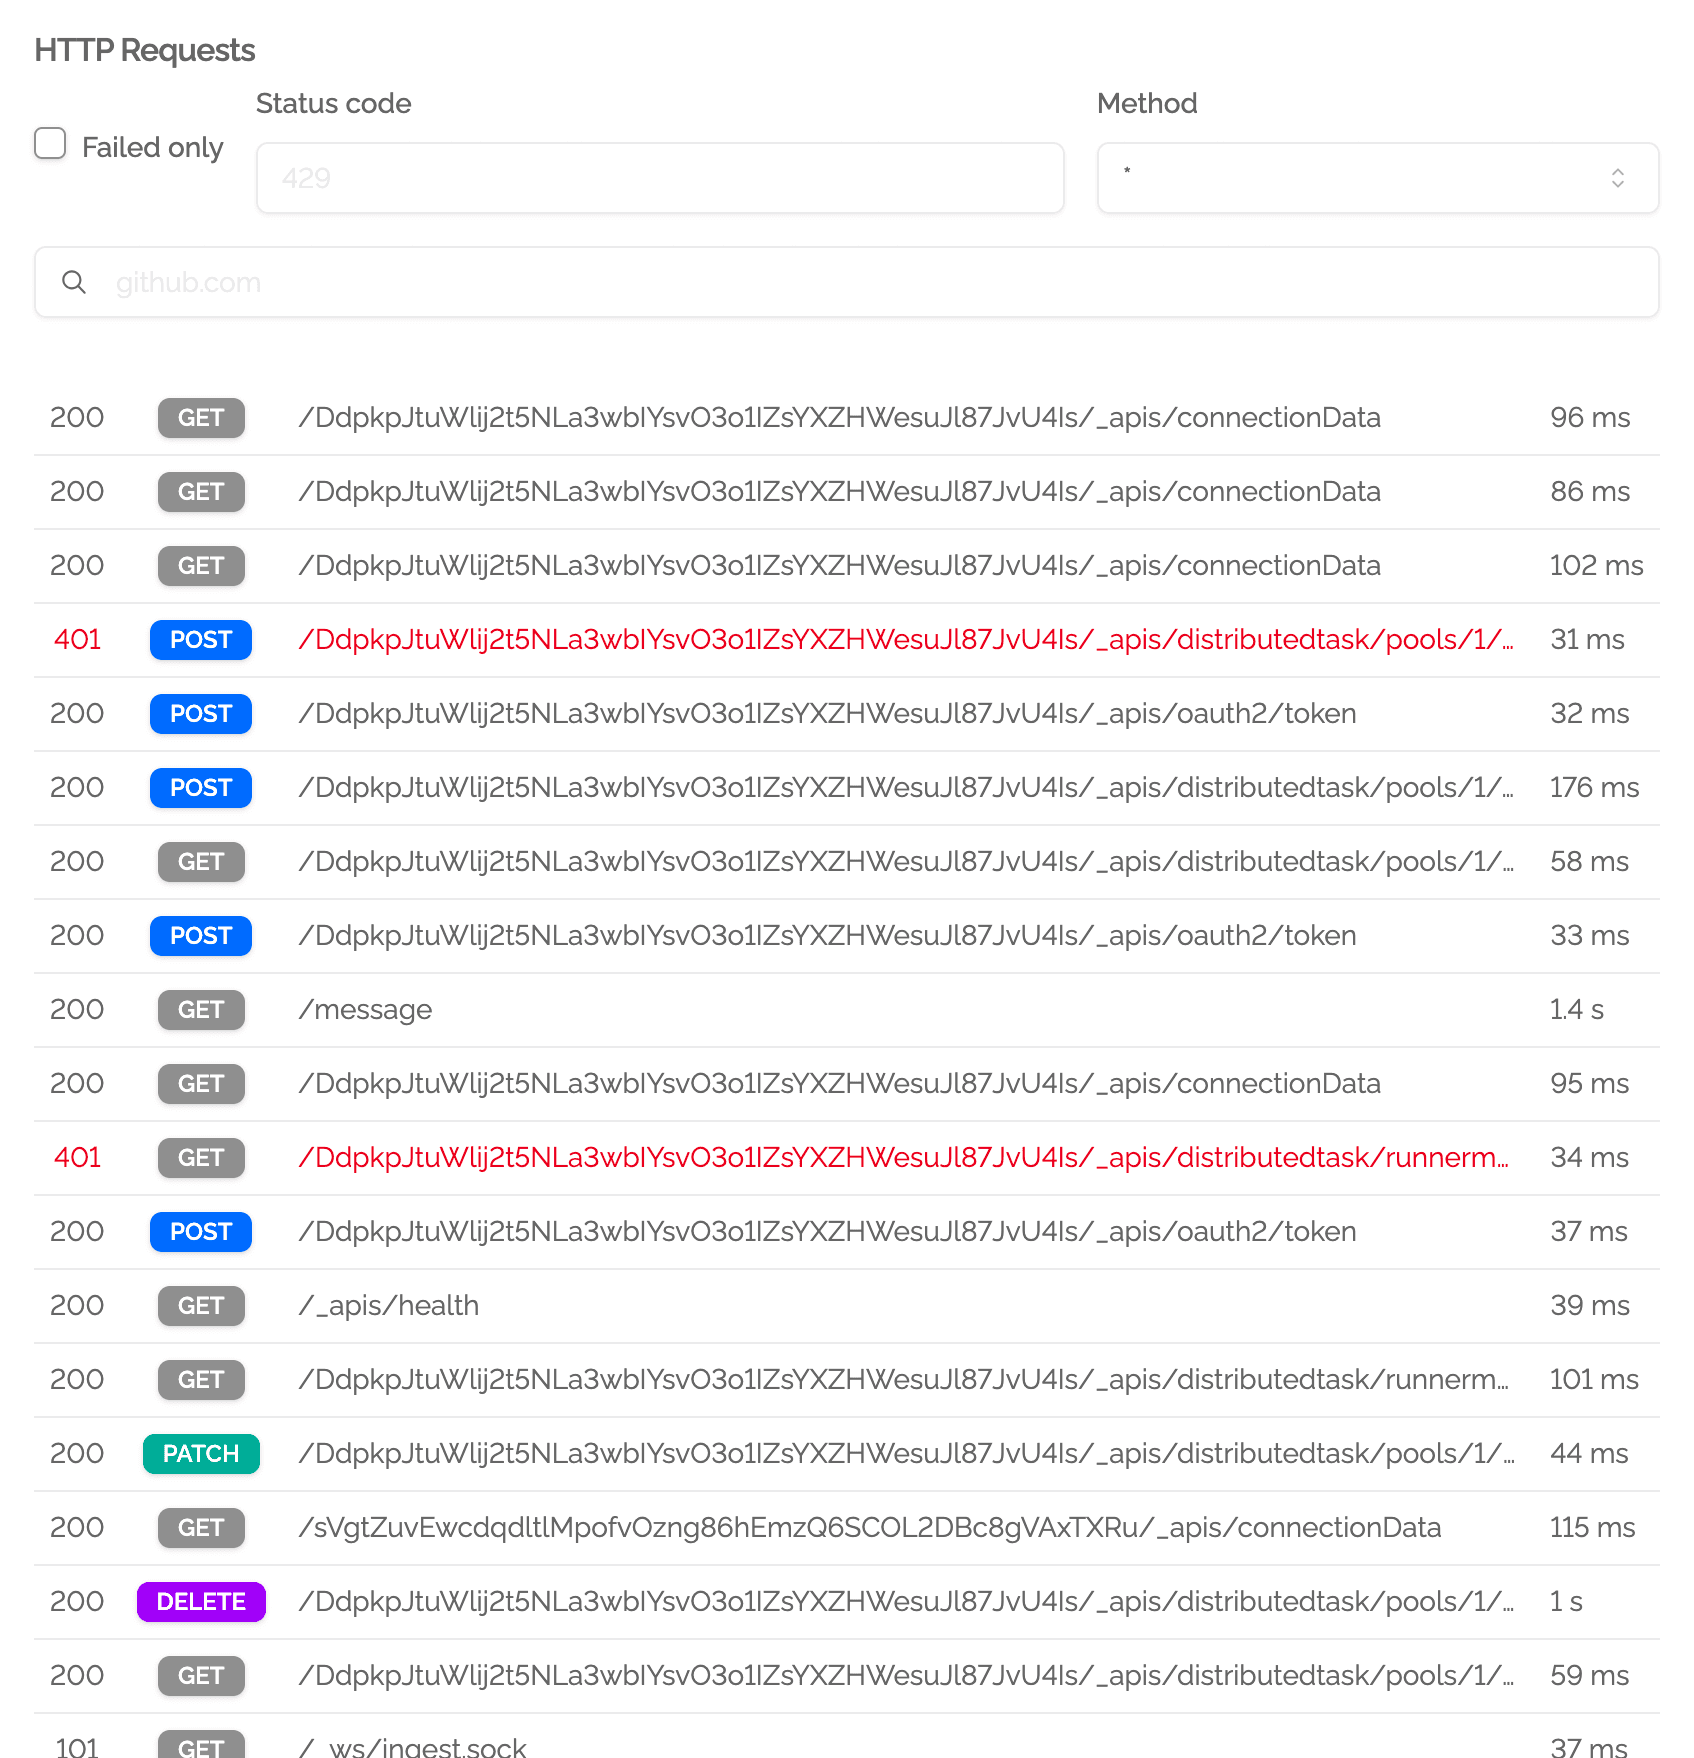
All HTTP requests made during your job are automatically captured, no extra setup or configuration needed. Once a job completes, you can browse all network calls directly from the Shipfox dashboard.
Explore network requests
View job-level traffic
Go to your past jobs list.
Select the job you want to inspect. This opens the job detail view.
Scroll to the Network tab. Use filters and search to narrow down requests.

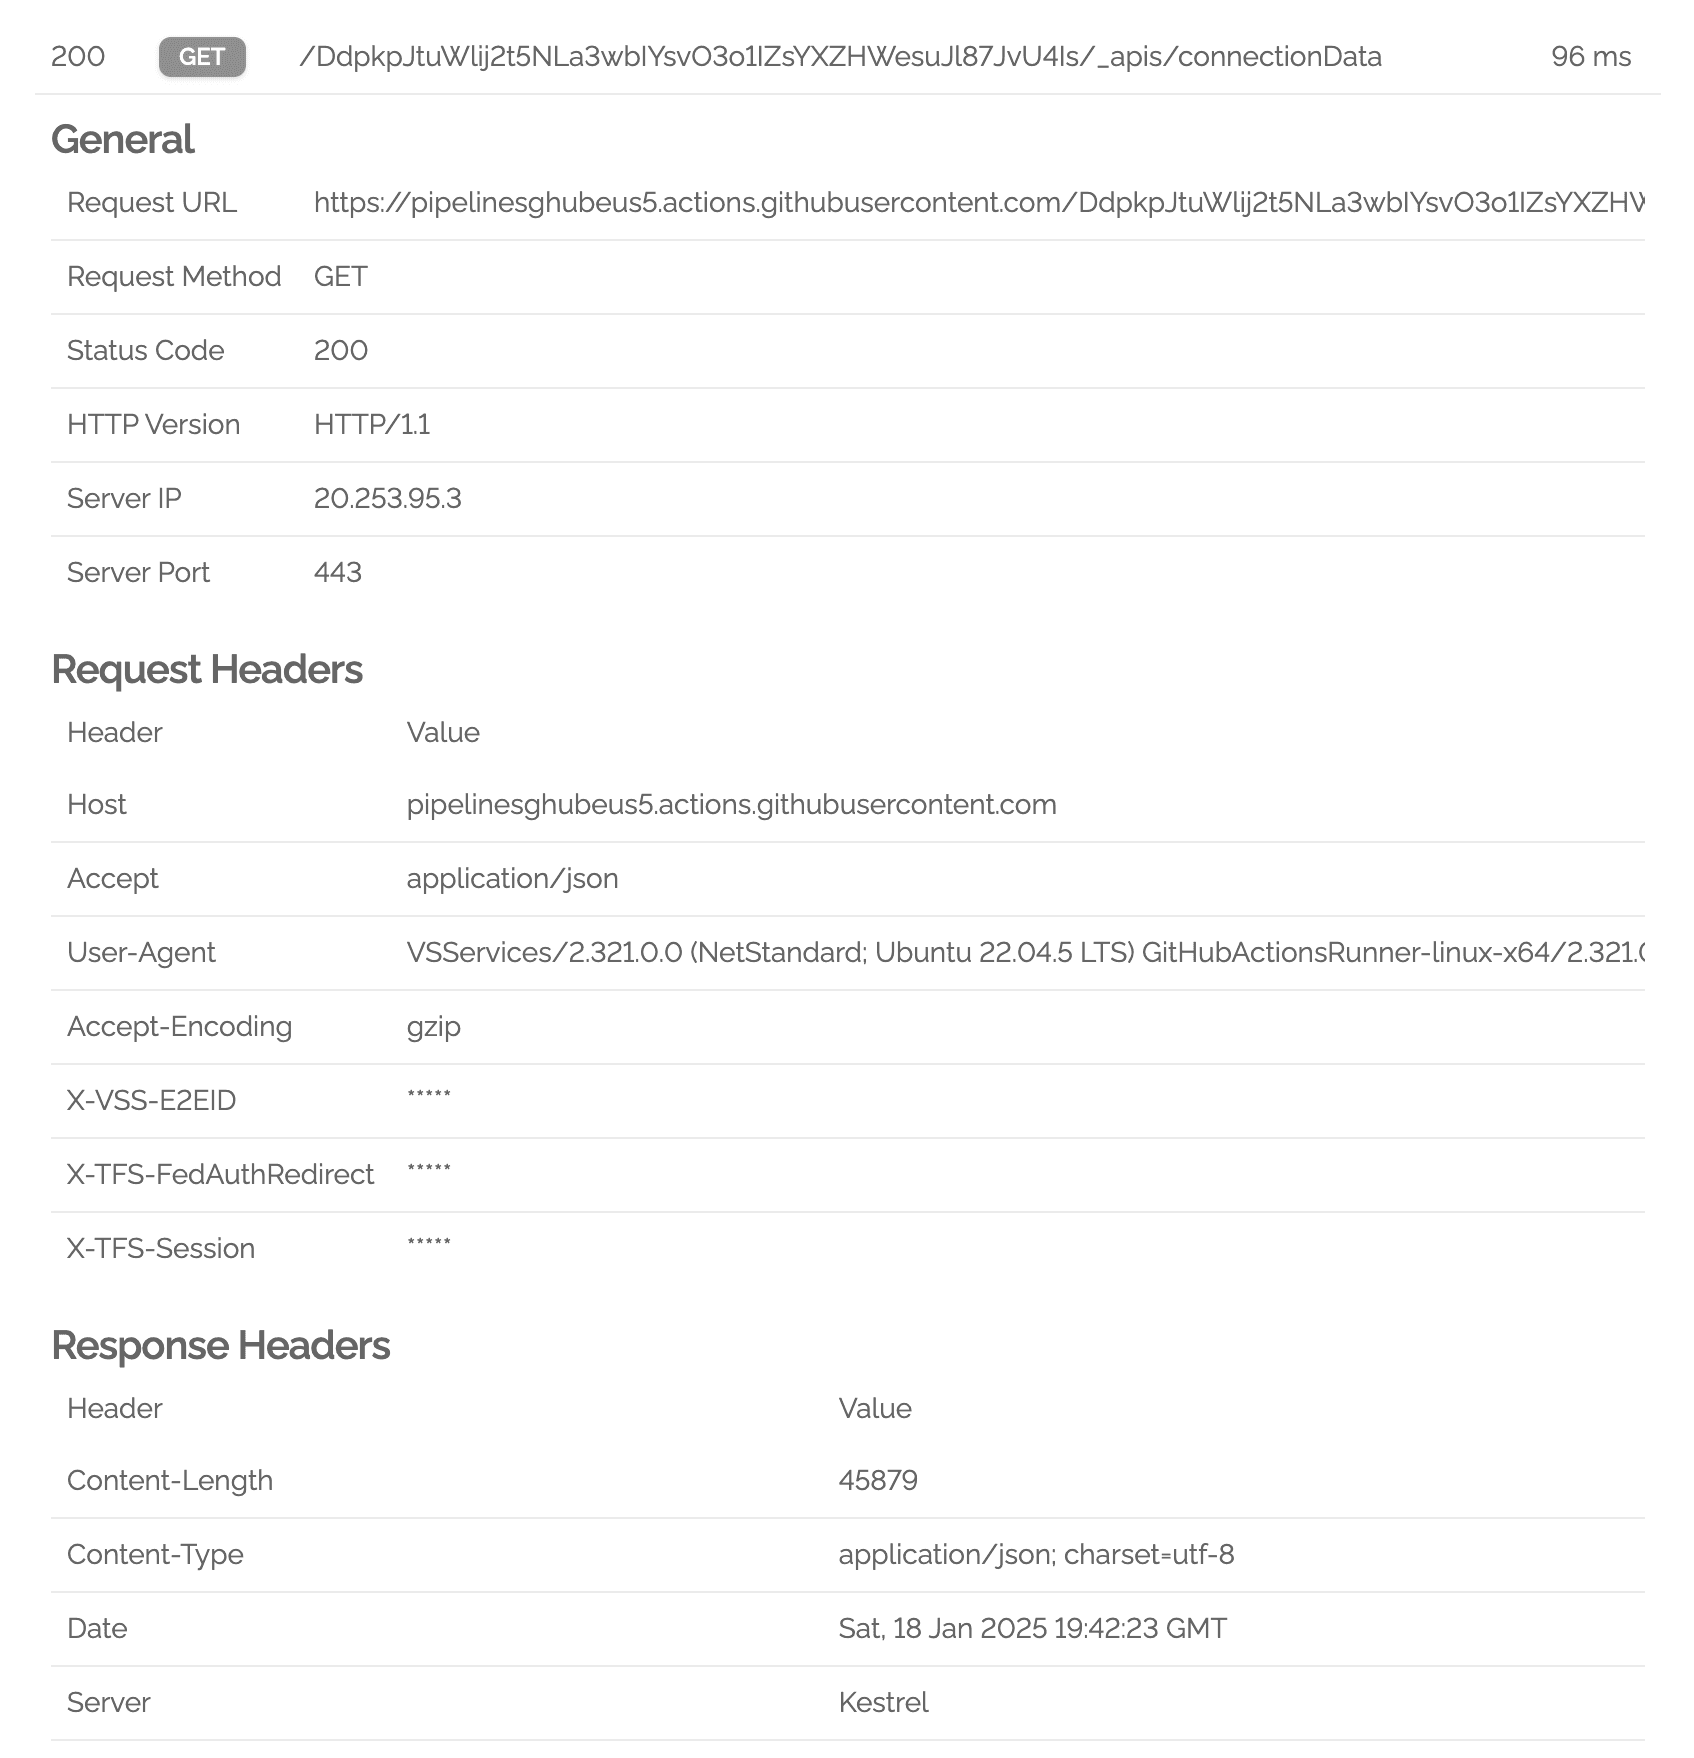
Inspect a single request
Click on any request to view full details, including:
- Request method, URL, and status code
- Request and response headers (with sensitive data redacted)
- Timing breakdown

Security and data handling
Shipfox prioritizes security and minimizes sensitive data exposure:
- Bodies: Request and response bodies are never stored or transmitted.
- Headers:
- Standard HTTP headers are logged in full (e.g., User-Agent, Content-Type)
- Non-standard or sensitive headers are redacted, only their names are stored
List of HTTP headers with logged values
- Accept
- Accept-Encoding
- Accept-Language
- Accept-Ranges
- Age
- Allow
- Cache-Control
- Connection
- Content-Encoding
- Content-Language
- Content-Length
- Content-Location
- Content-Range
- Content-Type
- Date
- ETag
- Expect
- Expires
- Forwarded
- From
- Host
- Keep-Alive
- Last-Modified
- Link
- Location
- Max-Forwards
- Origin
- Priority
- Range
- Referer
- Referrer-Policy
- Refresh
- Retry-After
- Server
- Server-Timing
- Transfer-Encoding
- Upgrade
- User-Agent
- Vary
- Via